
Common Cohort Report Questions
Advanced Options
1. Can I segment people based on time AND a property?
Not at the moment. Our Power Report and SQL Report are the best reports for segmenting people using multiple criteria.
2. What’s the difference between counting people … First Time vs. Every Time?
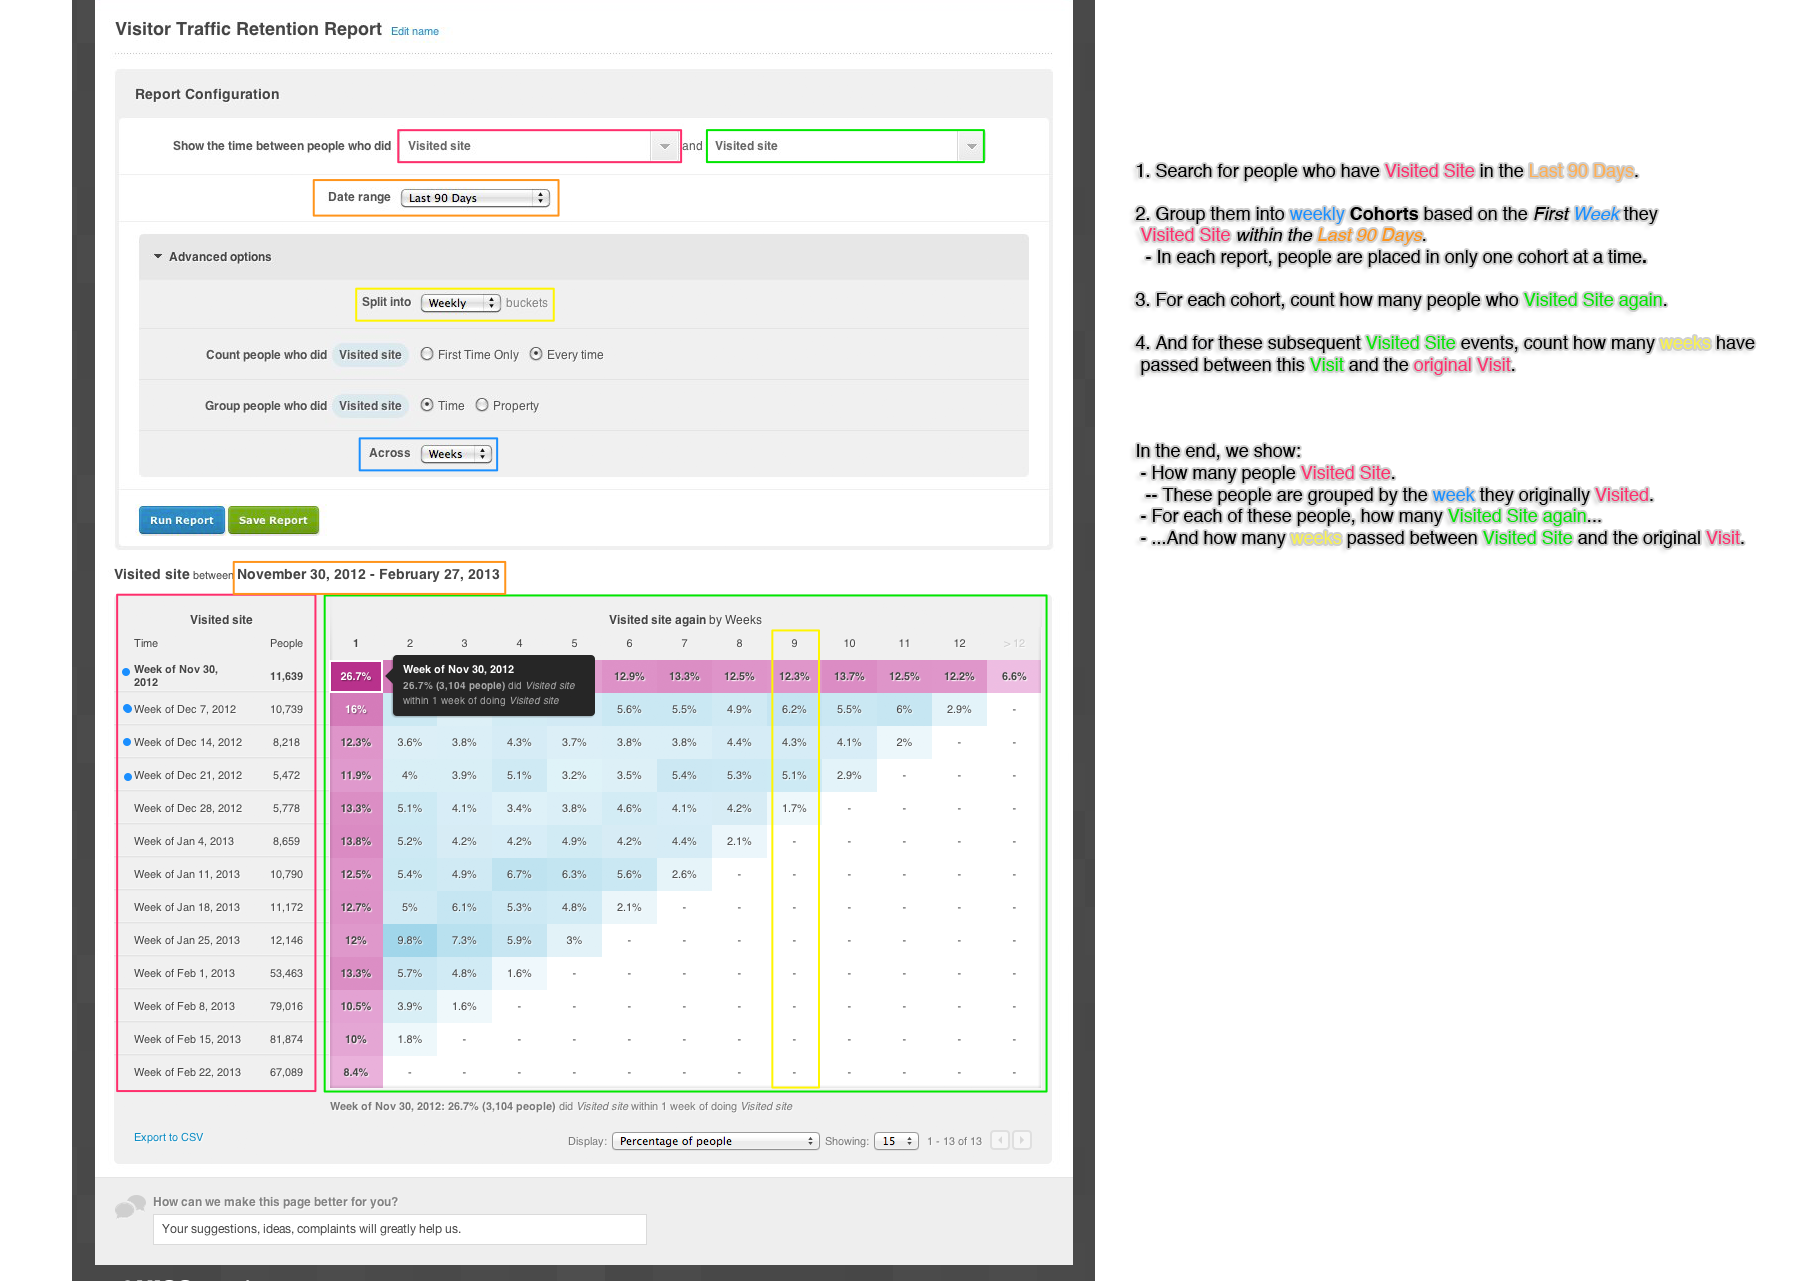
Let’s refer to our sample cohort report screenshot, that looks at the time between people doing Visited Site to doing Visited Site again.
- First Time: we look for the date of only the first Visited Site event after the initial Visited Site (their second Visited Site event). People are counted once for their first subsequent visit.
- Every Time: we look for all the dates of all the subsequent times people do Visited Site after the initial Visited Site that places them in their Cohort. People are counted more than once for each subsequent visit.
The difference is most dramatic if you switch the cohort report’s display options to display Cumulative People or Cumulative Percentage - it could potentially exceed 100% of people because people are being counted more than once.
3. How do I understand the results of my report?
To step through how to read a sample report, here is an annotated screenshot. Please click on the image to see it in full-size:

Comparing cohort results to other Kissmetrics reports
1. The people column in the Cohort Report does not match up with a People Search for the same week or month.
The Cohort Report groups people based on the first date they did the event in the date range of the report. A People Search looks for anyone who has done the event, regardless of whether they have done the event earlier.
To give an example, let’s refer back to the explanatory screenshot, and focus on the Week of Jan 4, 2013.
- The cohort report lists 8,659 people Visited Site for the week of Jan 4, 2013. Remember that these are only people who Visited Site who, between Nov 30-Feb 27, first Visited Site during the week of Jan 4.
- Because of this, a People Search for those who Visited Site between Jan 4-10, 2013 could list more than 8,659 people. Specifically, these would be people who Visited Site between Jan 4-10 but had also Visited Site earlier, between Nov 30-Jan 3.
2. I run this report every day and data changes for weeks that have already passed.
To give an example, let’s refer back to the explanatory screenshot, and focus on the Week of Jan 4, 2013. Let’s focus on the bucket for “Within 1-2 weeks of ‘the week of Jan 4, 2013’” (5.2% of people Visited again that week).
“Within 1-2 weeks of ‘Jan 4-10, 2013’” sounds straightforward - that corresponds to Jan 11-17. However, consider two people:
- Bob, who first Visited Site on January 4
- Fred, who first Visited Site on January 10
Both are included in the “Week of Jan 4” cohort, but “1-2 weeks of them doing Visited Site” is unique to each person. 1-2 weeks of Bob’s Visit is Jan 11-17, but 1-2 weeks of Fred’s Visit is Jan 17-23.
Thus, the bucket for “Within 1-2 weeks of ‘the week of Jan 4, 2013’” can potentially span Jan 11-23, depending on when people actually did that first Visited Site event.
Updated about 1 year ago