New User Guide
This guide should hopefully get you up to speed pretty quickly in Kissmetrics. It requires no implementation beyond adding the tracking code to your site.
Contents
- Adding the JavaScript Tracking Code
- Quickly Adding Data (Turning on Page Views)
- A First Look at the Data
- What Can I Do with the Data?
- Where Do I Go from Here?
Adding the JavaScript Tracking Code
To start using Kissmetrics, add the JavaScript tracking code to every single page of your site/app. You can find the tracking code in your site settings. You should start to see data come into Kissmetrics very soon (from the moment the data gets recorded, there’s a processing time of about 30 minutes before it actually shows in the app's reporting tools).
Automatically Tracked Data
There are some actions/information that Kissmetrics tracks automatically — for example, it tracks when users visit the site, what page they land on, what city/region/country they’re in, campaign information, etc. There’s a lot of data Kissmetrics tracks automatically, simply by having the tracking snippet on every page of your site.
Quickly Adding Data (Turning on Page Views)
Next, let’s quickly get a substantial amount of data in your account. That will enable us to build meaningful reports so you can start to understand how Kissmetrics really works and what it’s capable of.
To do so, turn on “Page Views”, like so (make sure to “Save changes”!):
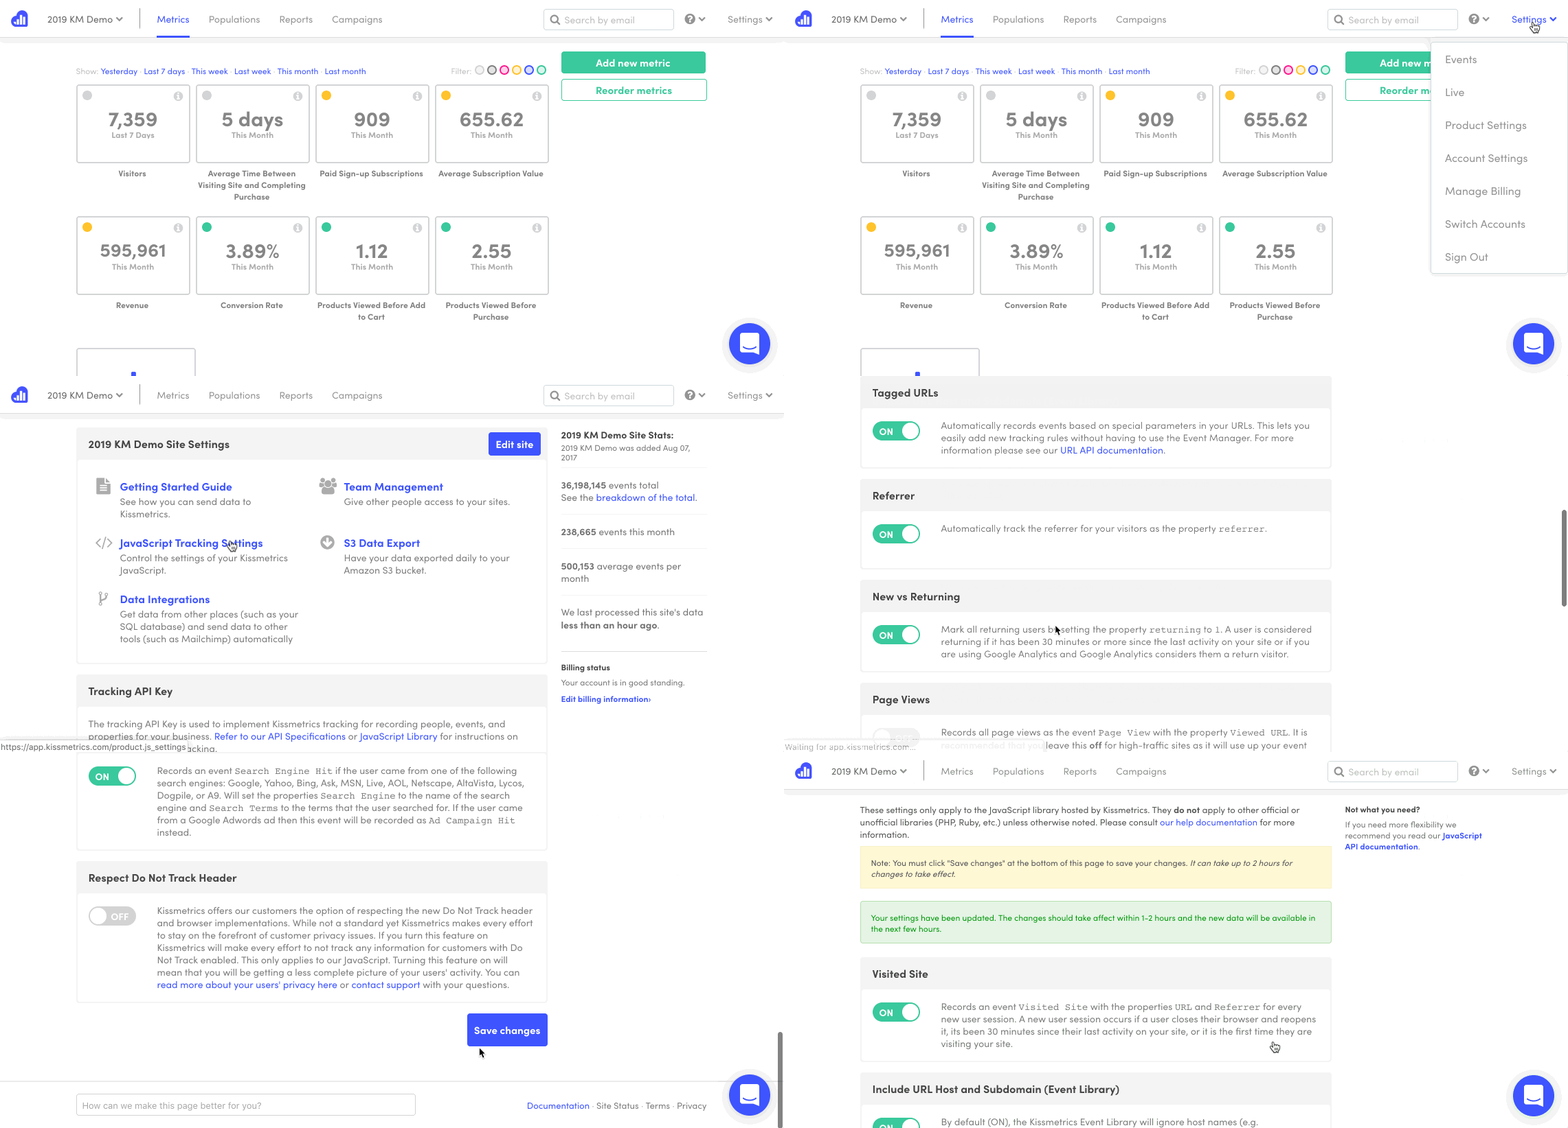
By turning on “Page Views”, Kissmetrics will track every instance a user visits any page on your site. You can turn it off at any point in time.
Note: Now that you’ve turned on “Page views”, you may have to wait at least a few hours for enough data to gather in your account. And as mentioned earlier, there’s a 30 minute processing delay in Kissmetrics for reporting purposes. Live, however, will show data that's getting recorded in real time.
A First Look at the Data
Aside from the actual people who come to your site, “events” and “properties” are the building blocks of Kissmetrics.
-
Events are actions users take on your site
-
Properties help add context to events and/or users. And they are always key/value pairs. In other words, each property will have a property name and a corresponding value. The property name is consistent every time that particular property is recorded while the property value can vary.
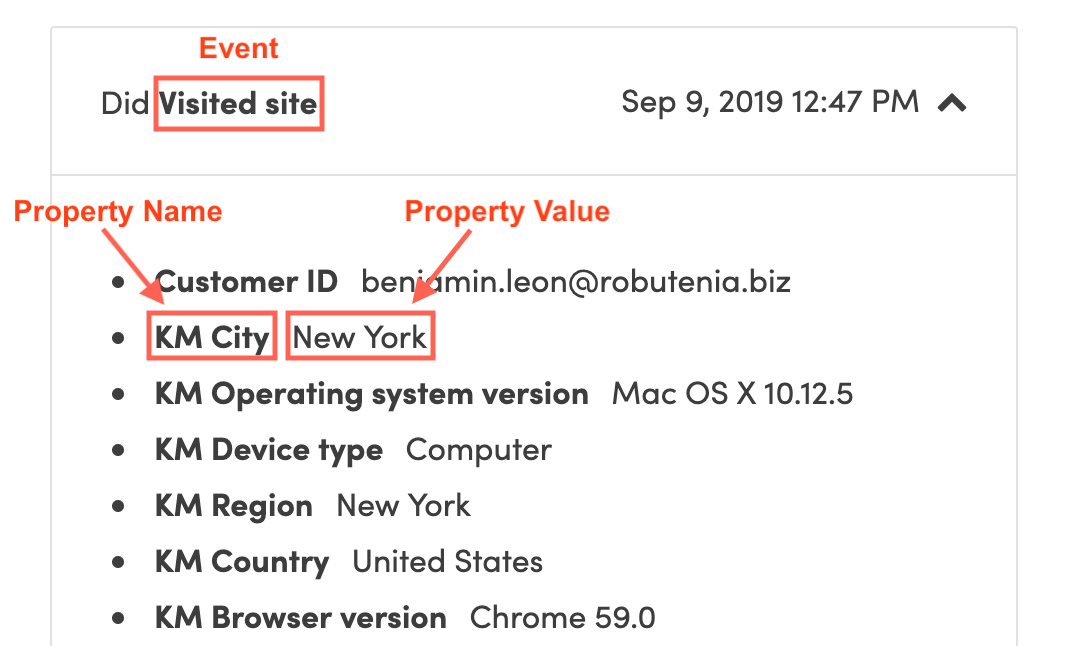
So let’s again consider the “Page Views” data that’s now getting collected in your Kissmetrics account. In this case, the event is “Page view” — that’s the action the user takes; they view a page. Along with the “Page view” event, two properties also get recorded: “Viewed URL” and “KM Previous Page”. The value that corresponds to the “Viewed URL” property is the actual URL of the page the user views. And the value that corresponds to the “KM Previous Page” property is the previous page the user was on.
Example:
If someone were to navigate from the homepage ([www.example.com](www.example.com)) to the blog ([www.example.com/blog](www.example.com/blog)), the following data would get recorded

  - Event: “Page view”
  - Property: “Viewed URL”: “[www.example.com/blog](www.example.com/blog)”
  - Property:“KM Previous Page”: “[www.example.com](www.example.com)”

If they were to then navigate to a particular blog article (www.example.com/blog/article1), the following data would get recorded:

  - Event: “Page view”
  - Property: “Viewed URL”: “[www.example.com/blog/article1](www.example.com/blog/article1)”
  - Property: “KM Previous Page”: “[www.example.com/blog](www.example.com/blog)”
This is just one example of how events and properties work. The main idea to remember is that events represent actions the user performs while properties help provide information related to those events.
What Can I Do with the Data?
With the automatically-tracked data you’ve gathered, let’s build a few reports to better understand how you can use Kissmetrics data.
Activity Report
The Activity Report allows us to report on a specific event (you can also use it to compare events). It’ll tell you how many times an event was recorded in a specified date range and how many people recorded them. Then, you can segment that information to get further insights.
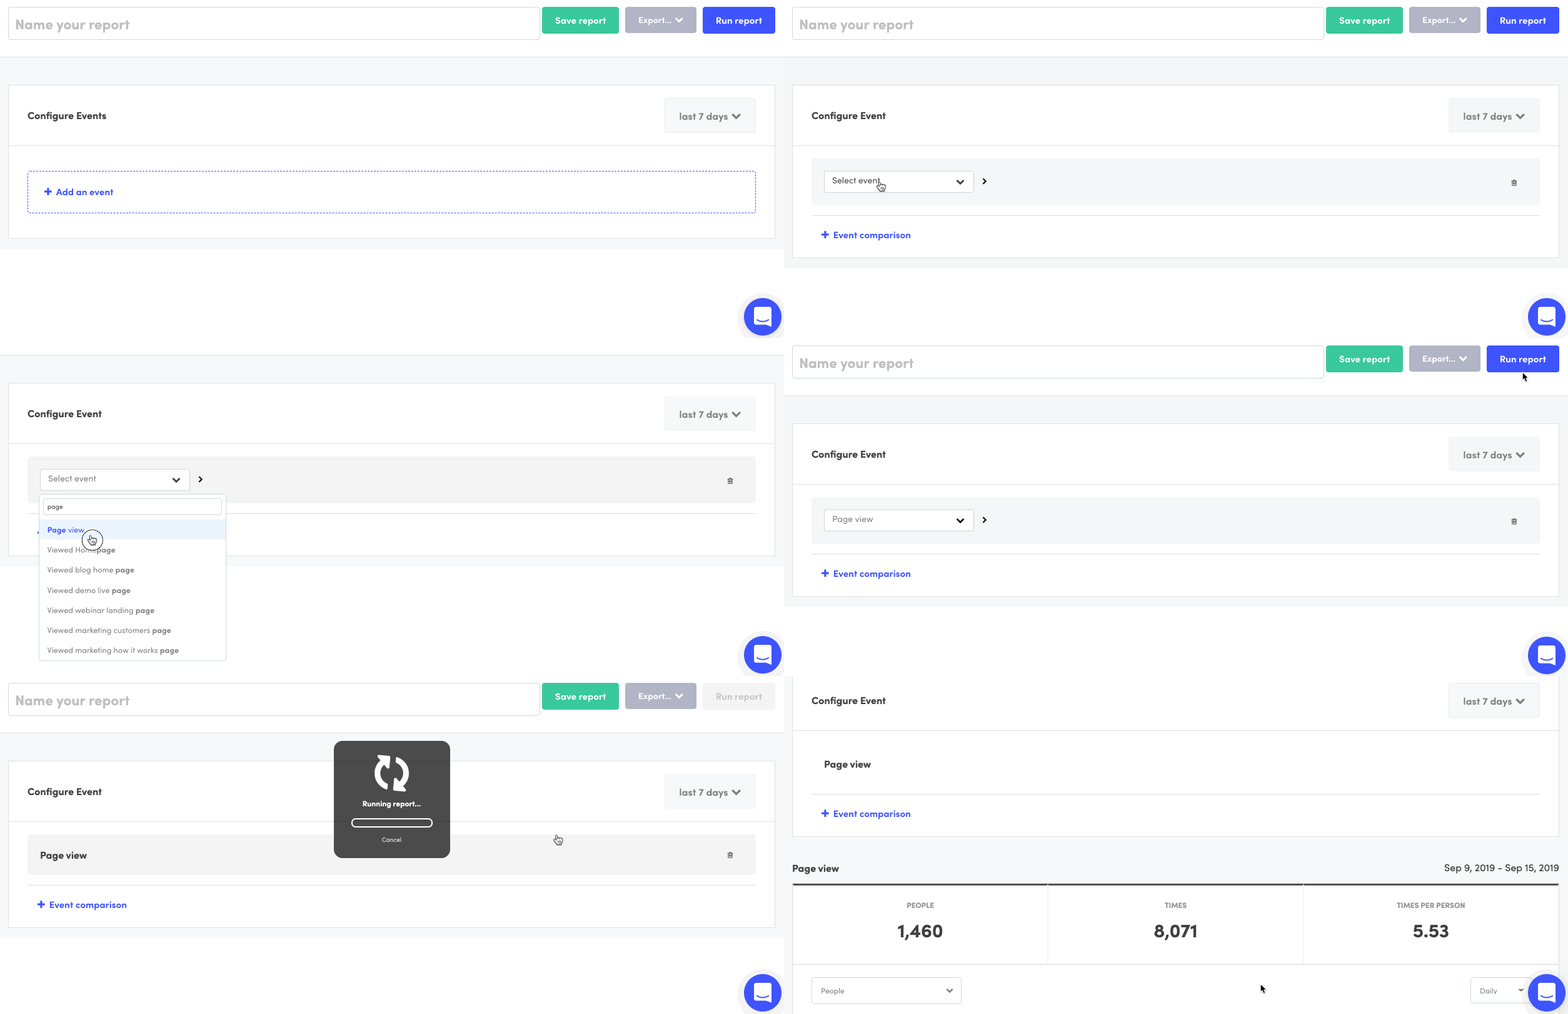
To help illustrate, let’s create a simple Activity Report. Select “Page View” as your event. When you “Run Report”, you should see the number of times “Page View” has gotten recorded in the specified date range as well as the number of people who recorded it (if you only started recording data today, make sure to change the date range to “today” because the “Last x days” default date range does not include the current day).
Segmenting Activity Report Data for More Insights
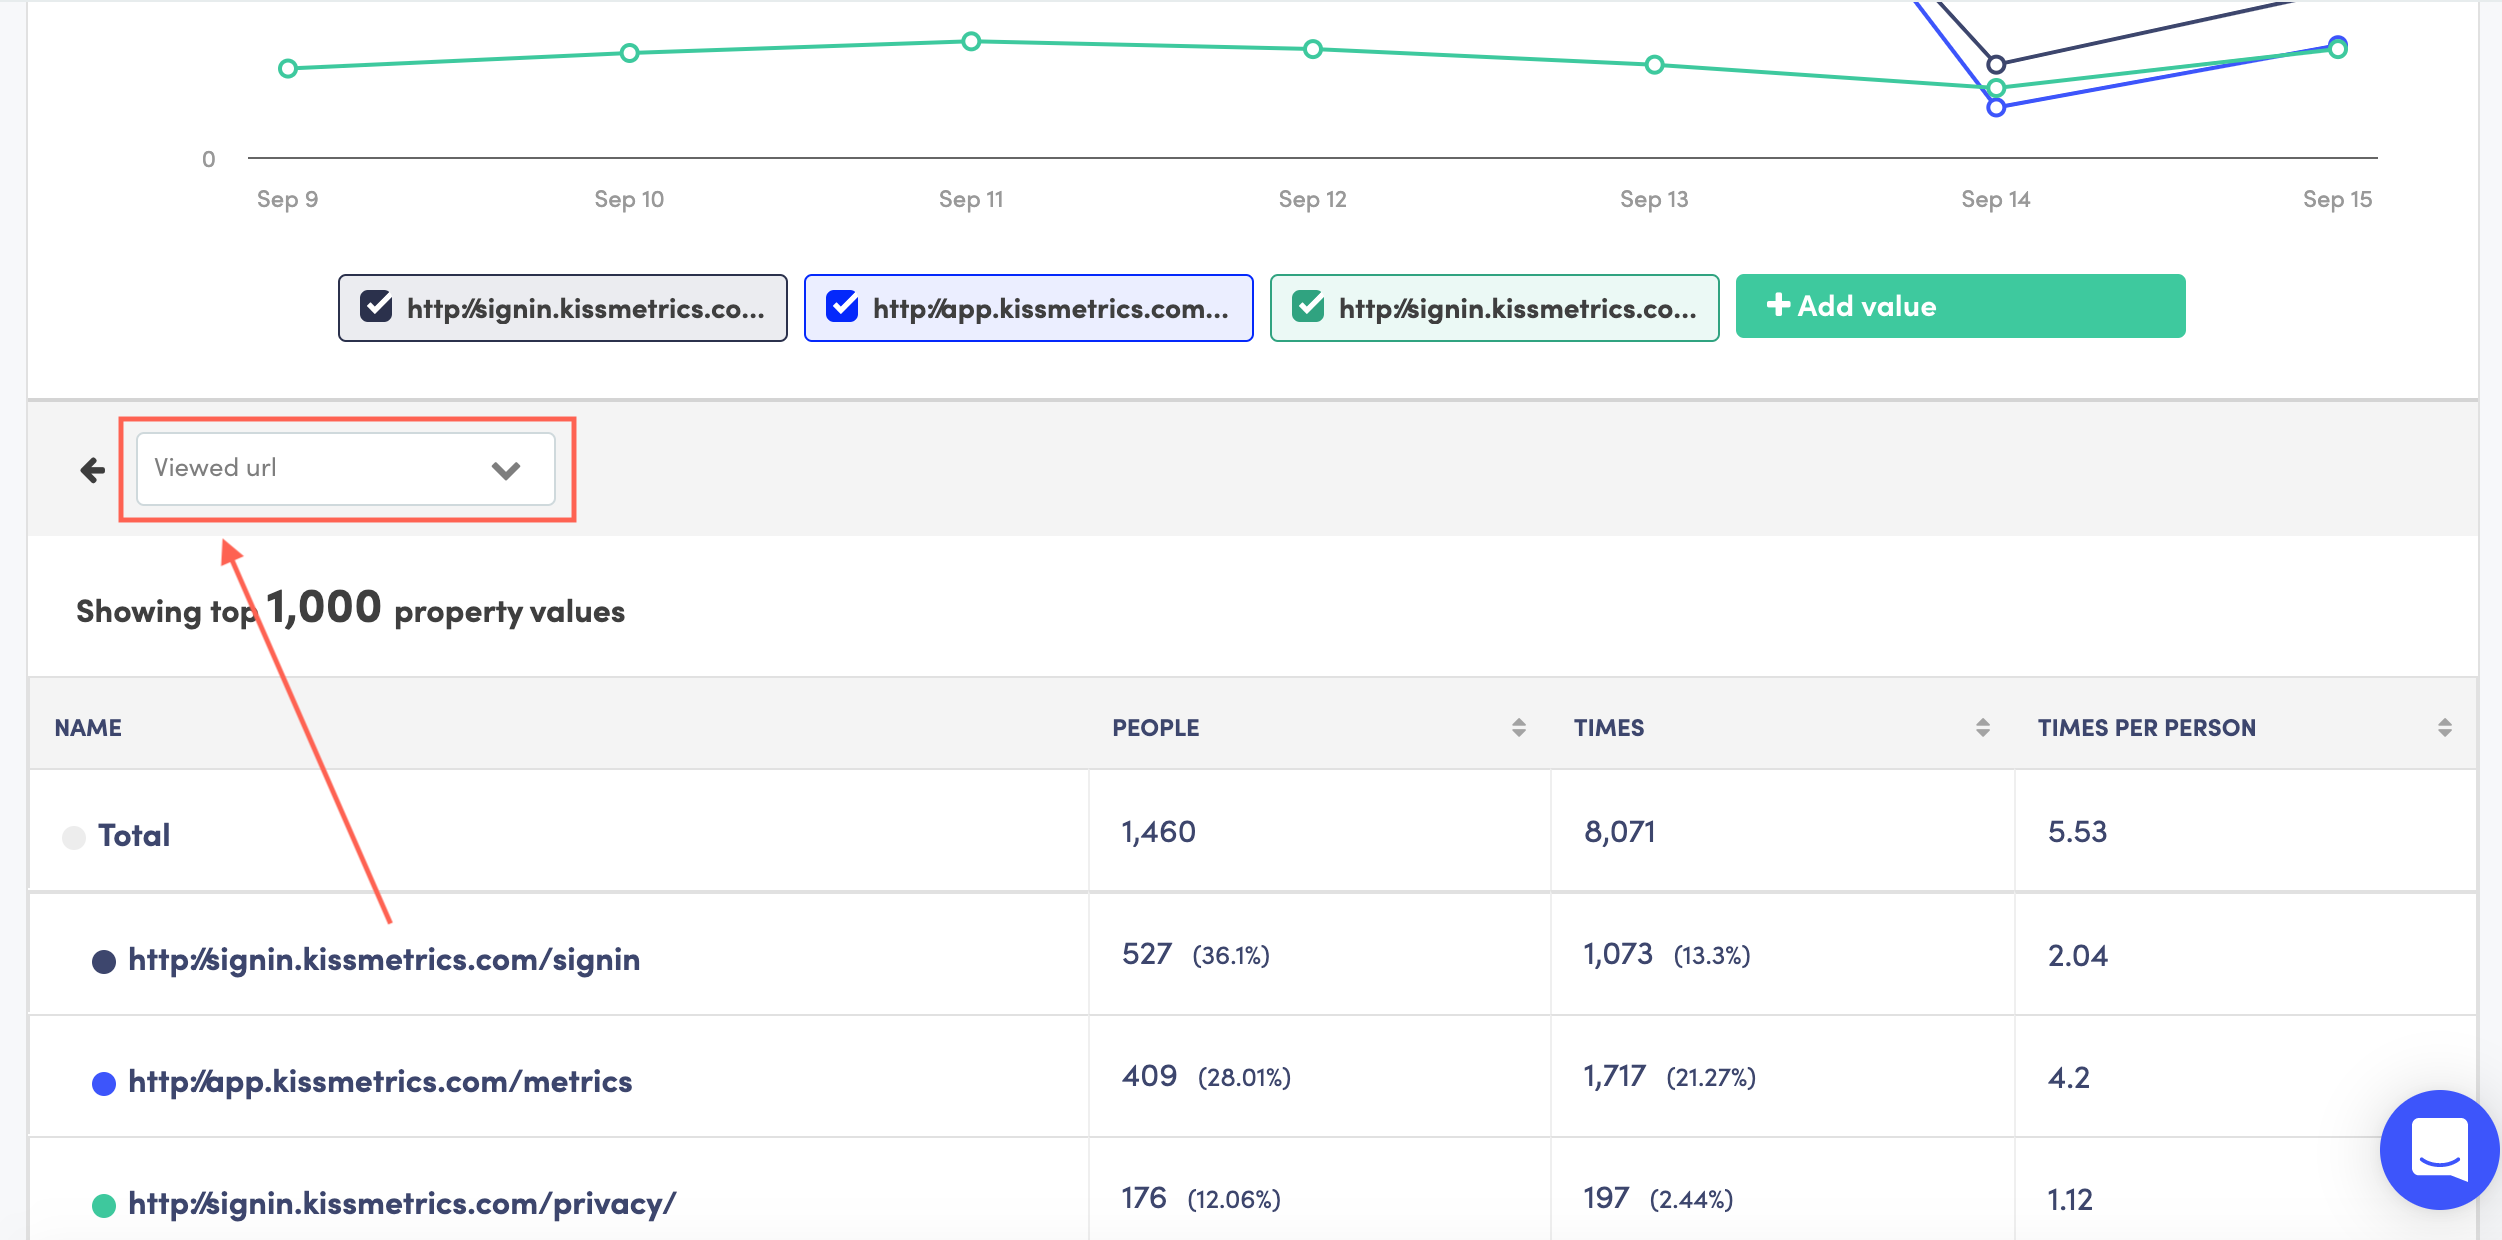
Now we can segment the data by “Viewed URL” to see a breakdown of which pages were viewed specifically, how many times they were viewed, and by how many people. To do so, just select “Viewed URL” from the dropdown menu below the graph.
Funnel Report
The Funnel Report enables you to see how users progress through specific paths — or funnels. Let’s create a basic Funnel Report using two or three specific pages in your site. For your first step, select “Page view” as the event, and click the arrow at the end of the row to specify the “Viewed URL” at this initial step.
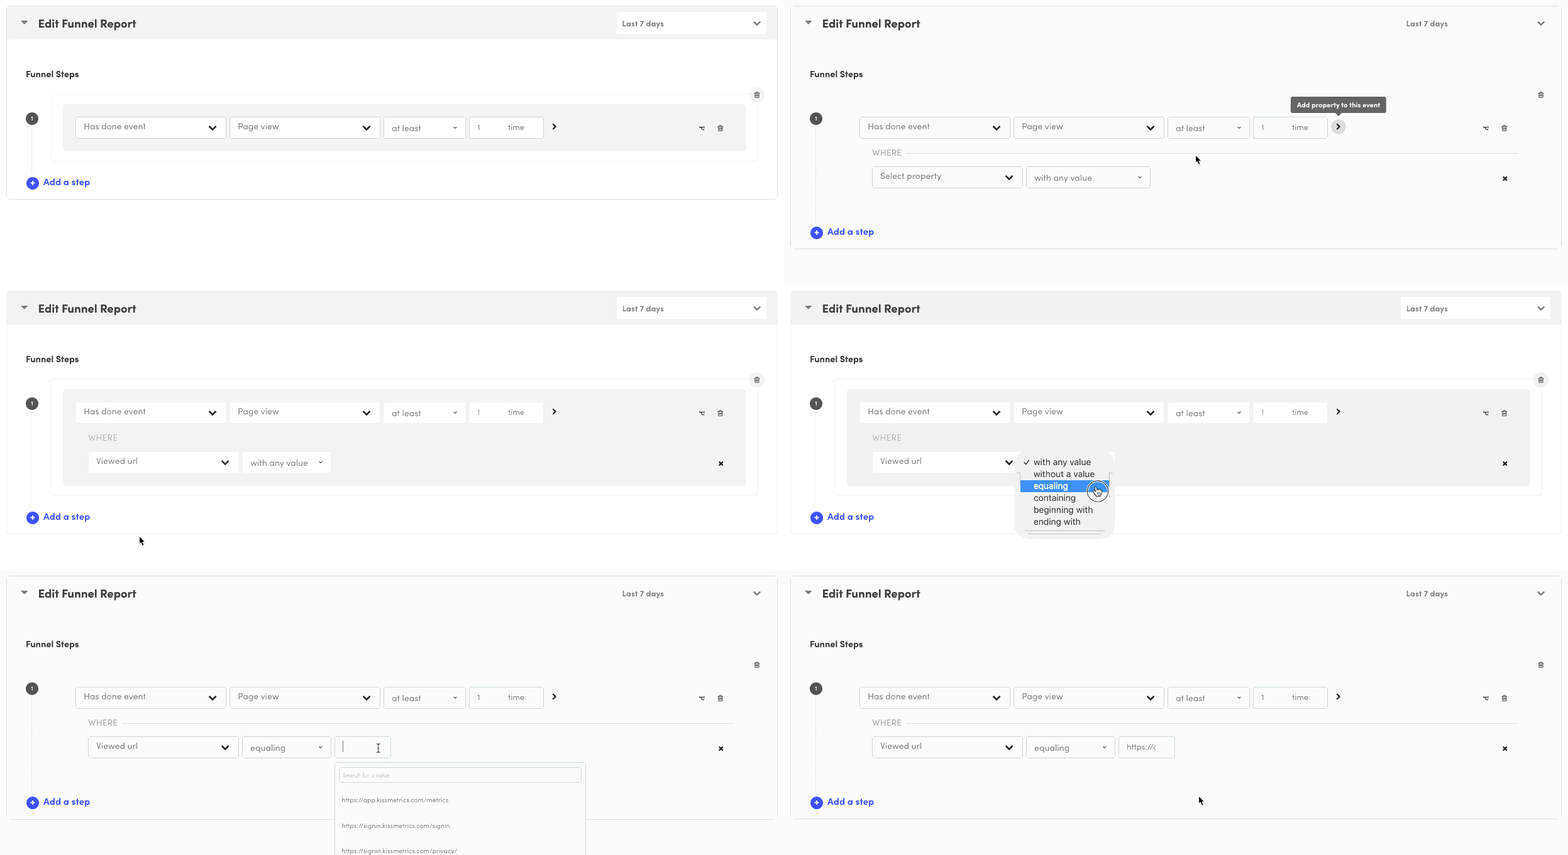
This functionality which enables you to "add property to this event" works with properties that were recorded along with the event — at the very same time. In this case, since the "Viewed URL" property gets recorded at the same time as the "Page View" event, it shows up in the drop down. Go ahead and set the “Viewed URL” to equal the homepage of your site.
Then do the same for the second step of the funnel, except in this case choose a different “Viewed URL” value. Ideally, you would choose a page that users might logically visit from the homepage. Note that you can select options like "...where Viewed url CONTAINING..." or "where Viewed url BEGINNING WITH..." where app.
Finally, to create a third step, do the same while choosing a logical third “Viewed URL”. If you have a thank you page, you may consider making that the last step in your funnel. Once again, the URL you use doesn’t have to be exact. It may make more sense to configure the condition so that “Viewed url” contains a part of your page URL. For example, if the thank you page looks something like “www.example.com/order/472369/thank-you”, it would probably make sense to set your condition to “where Viewed url containing /thank-you”. Your report configuration should end up looking something like this:
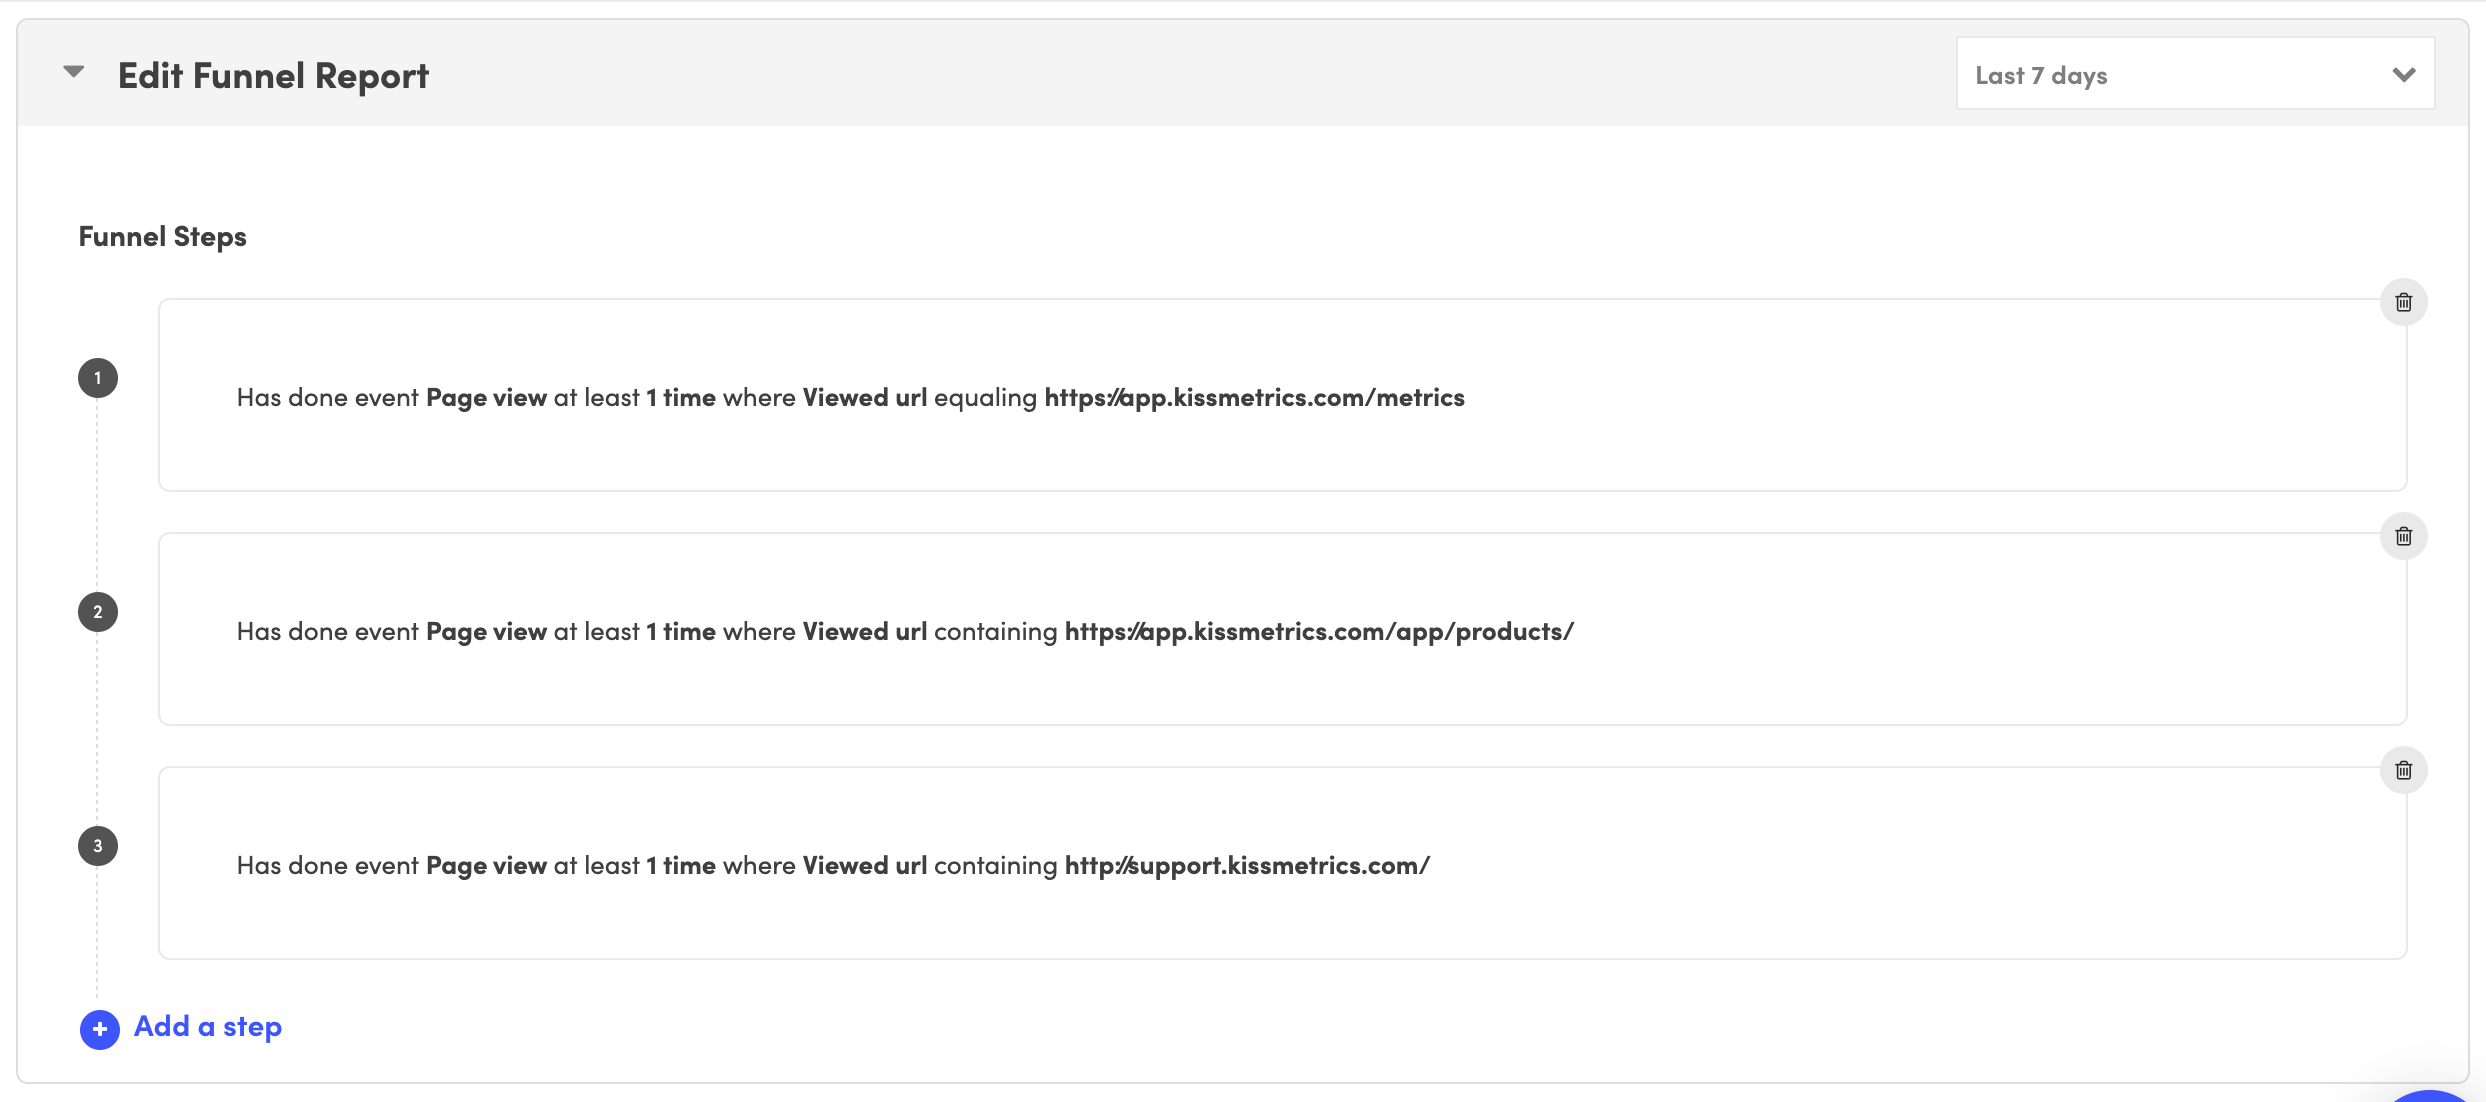
Of course, the values you see for "Viewed url" should correspond to pages that exist on your own site.
Now just hit the blue "Run report" button in the top right, and check out the results. Do be aware of the date range you specify in the report configuration. Make sure it's a date range that would include data that has been recorded so far (again, remember that the "Last X days" setting does not include the current day).
Segmenting Funnel Report Data For More Insights
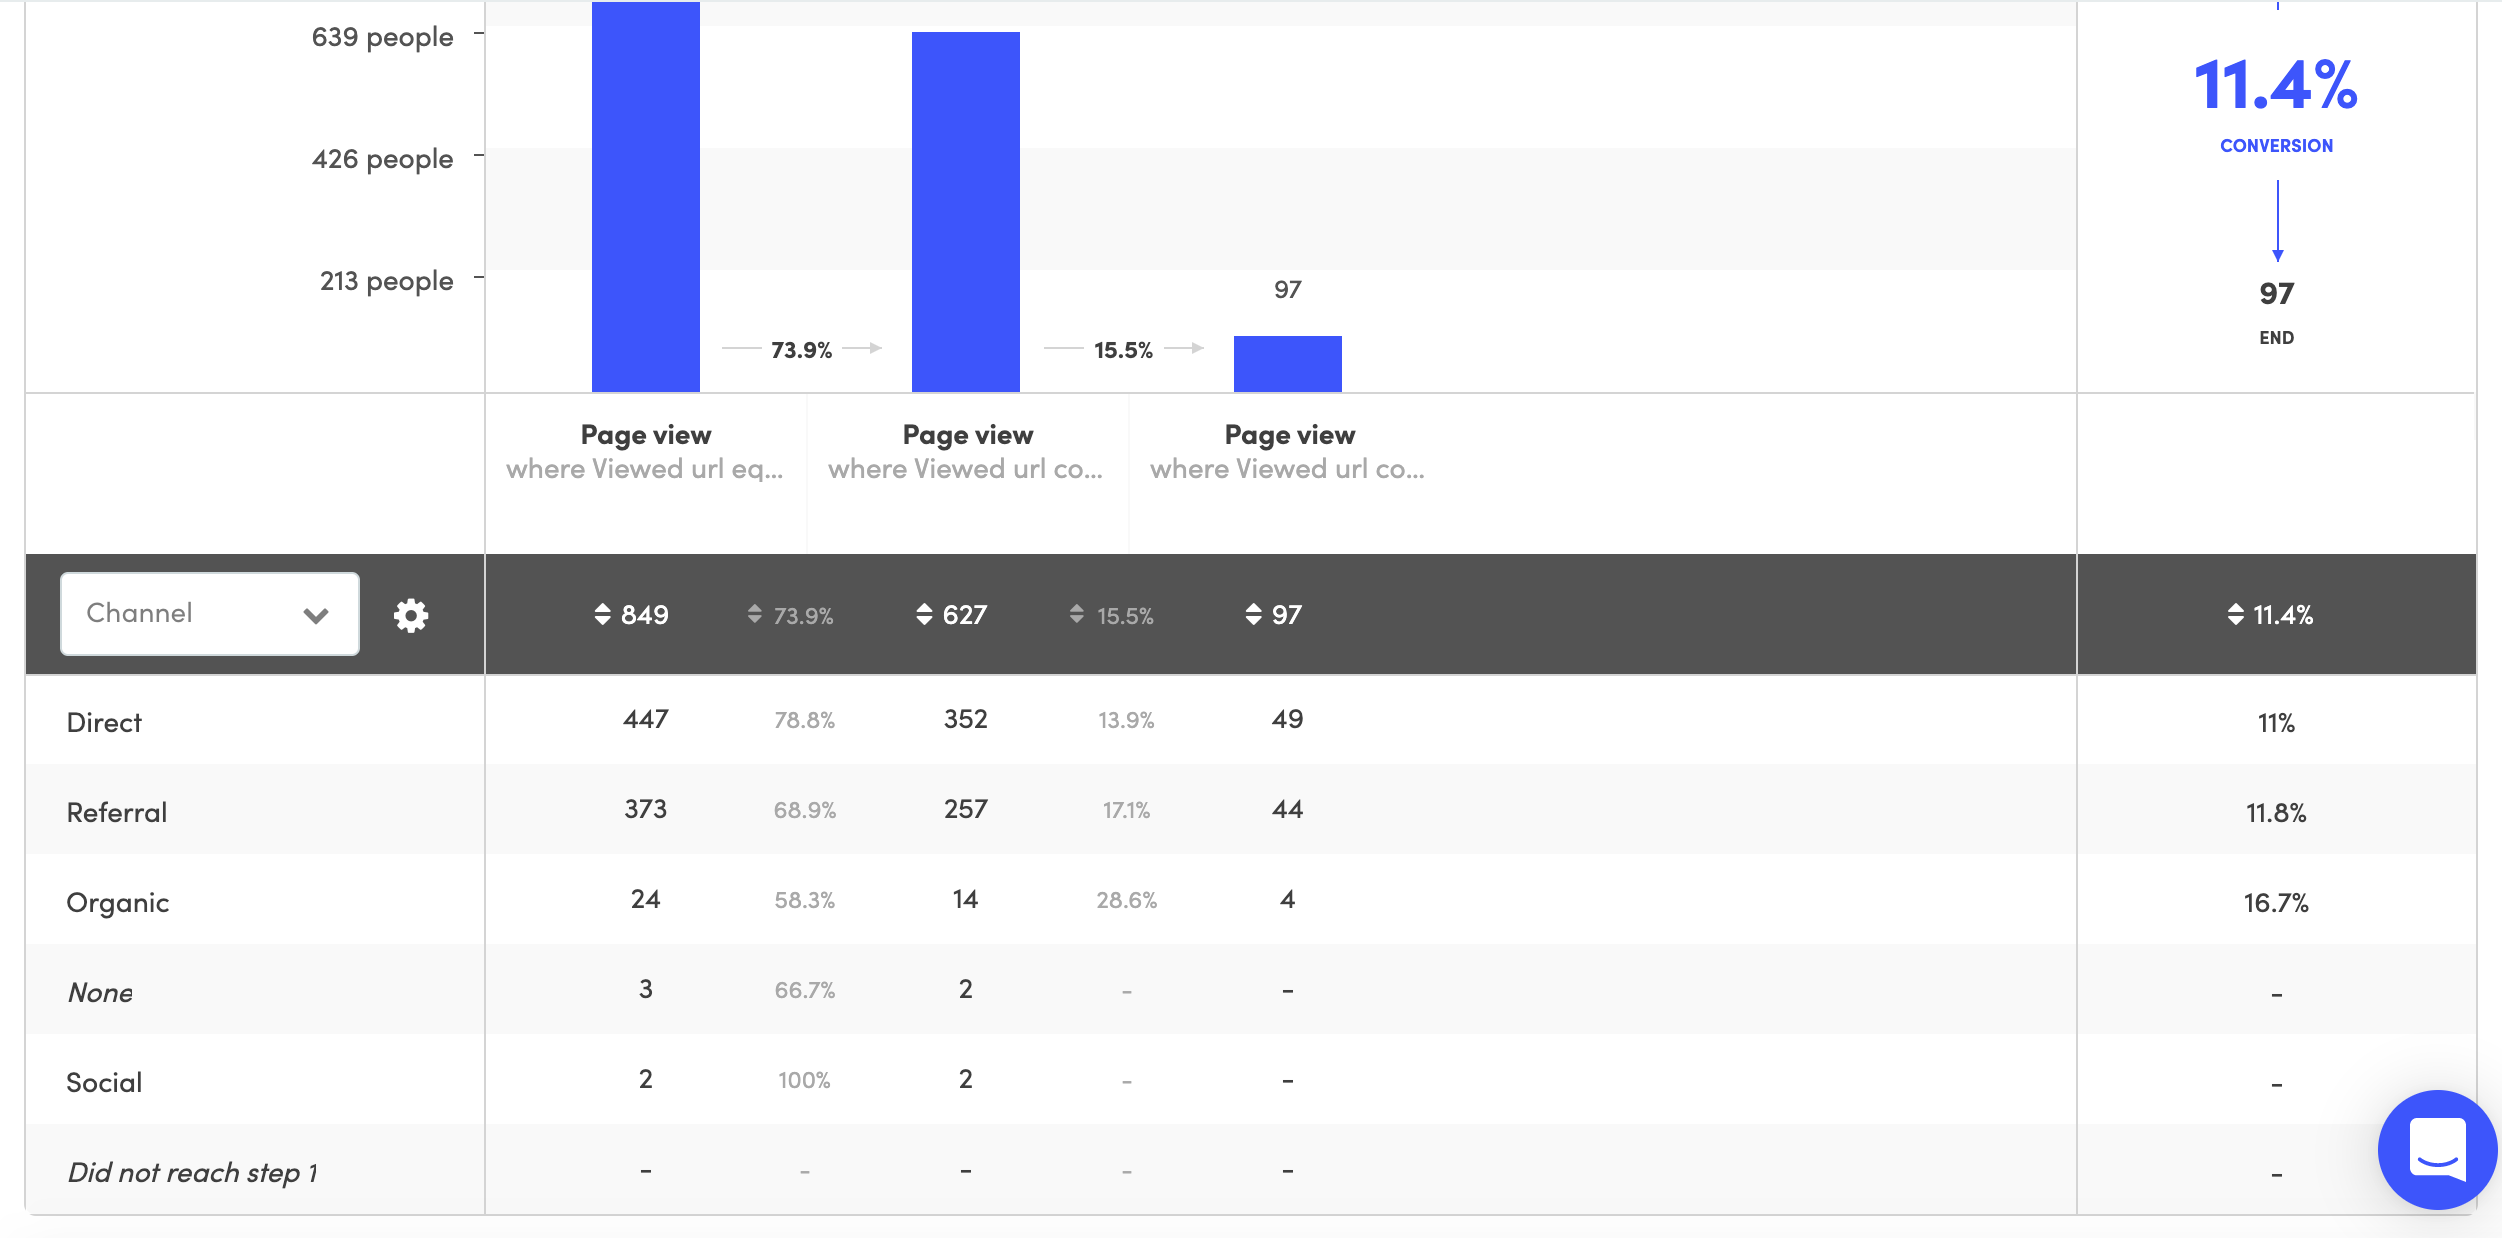
Now, just as we did in the Activity Report, you can segment this data to better understand the users in this funnel. For example, you can gain insight into where these users are coming from by segmenting the data by "Channel" (this is an automatically tracked property in Kissmetrics).
What Else Can I do with the Data?
The reports we’ve created here are just the tip of the iceberg. There are a number of other reports and metrics to explore and a myriad of ways to configure them. But hopefully, you now have a solid foundation on which to build.
Where do I go from here?
Check out the other reporting tools and try creating some other Reports/Metrics just as we’ve done here (remember, you can always delete them afterward). It’s a good idea to start getting familiar with the tools you have at your disposal. As we saw in this guide, you’re already able to construct some meaningful reports with the data that’s automatically getting tracked in your account.
And other than getting more familiar with the reporting tools, you should start thinking about what you want to track specifically. It’s advisable to focus on the most important actions — your key performance indicators, or "KPIs" — especially at the outset. People often make the mistake of tracking as many things as they can think of, and they end up with confusing, cluttered data. The best approach is to start by tracking the most important actions, and slowly and thoughtfully build on from there.
Here are some good support documents to help get you started:
Updated 8 months ago
