How to Test Kissmetrics Is Tracking By Using Your Browser's Developer Tools
You can use your web browser’s developer tools to quickly poke at the HTML and JavaScript of the page, as well as to debug the Kissmetrics JavaScript API.
Opening the Developer Tools
Chrome
- Option 1: Right-click almost anything on the page and “Inspect Element”
- Option 2: View Menu -> Developer -> View Developer Tools
Firefox
- Option 1: Install the Firebug add-on, whose interface is pretty similar to Chrome’s developer tools.
- Option 2: Tools -> Web Developer -> Developer Toolbar, where you can turn on the Web Console and Inspector as well.
Elements
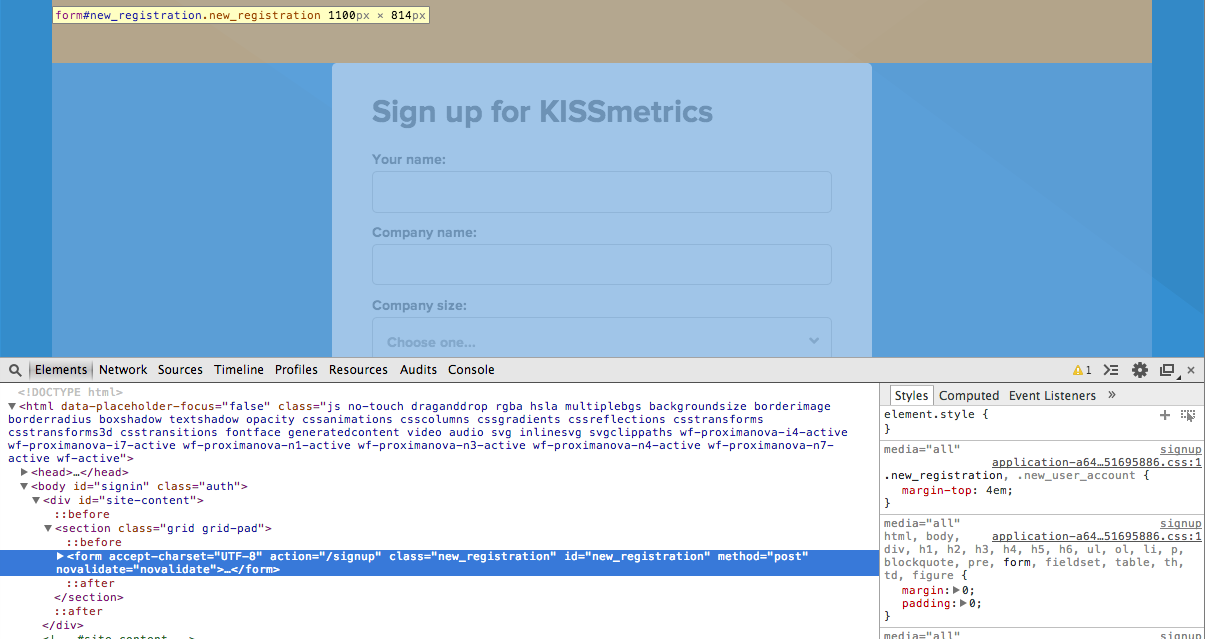
The elements panel shows the HTML source of a page in a neat hierarchy. This helps with two tasks:
-
Look up the
IDorClassof an element, to track clicks or form submissions. The previous links are tutorials for tracking clicks and forms in the Event Manager. -
On the right, you can look at a selected element’s “Event Listeners”, to see if our JavaScript library is hooked in and “listening” for when someone clicks (onmousedown) or submits (submit) the selected form or button. In the screenshot, the signup form is selected, and one of the submit event listeners includes doug1izaerwt3.cloudfront.net…. which represents our JS library. That means our Event Manager or an API call has found this form and is listening for the form’s submit event to fire off a Kissmetrics event of its own.

Network
As you browse during testing, look for requests to trk.kissmetrics.io; these tracking URLs will be structured according to our API specifications
trk.kissmetrics.io/e: for recording an eventtrk.kissmetrics.io/s: for setting properties without an eventtrk.kissmetrics.io/a: for alias
Network Headers
Referring to the screenshot, there are some things to note:
Status Code: 200 OK. That means our tracking server received the event just fine, and you can consider this event as successfully triggered. Then it’s just a matter of time (up to 30 minutes) to allow our servers to process these recently-fired events for reporting everywhere else in our application.- There’s a group of information called Query String Parameters. Again, these refer to our API specifications, and it’s straightforward to understand what these mean:
_n: View Sign Up Page (name of the event being recorded)_k: the API key_p: the person/identity doing the event_t: the timestamp in seconds in Unix time. This is a good site to translate the time into a human-readable date. http://www.epochconverter.com/- Any Kissmetrics Property: Its Recorded Value.
The info here is nicely broken down, but you can see it all contained in the full Request URL (top item) as one big URL-encoded URL.
Viewing the network requests help you confirm a few key items all at once:
- Does the API key match the one for the Kissmetrics site you’re using?
- Who is the person doing the event?
- What is the name of the event?
- Are additional properties being passed?
Last thing: there’s a black circle in the bottommost bar (5th icon from the left), which “Preserves Log Upon Navigation” so you don’t lose the history of events as you go from page to page. Turn it on if you expect to look at events across multiple pages.
Console
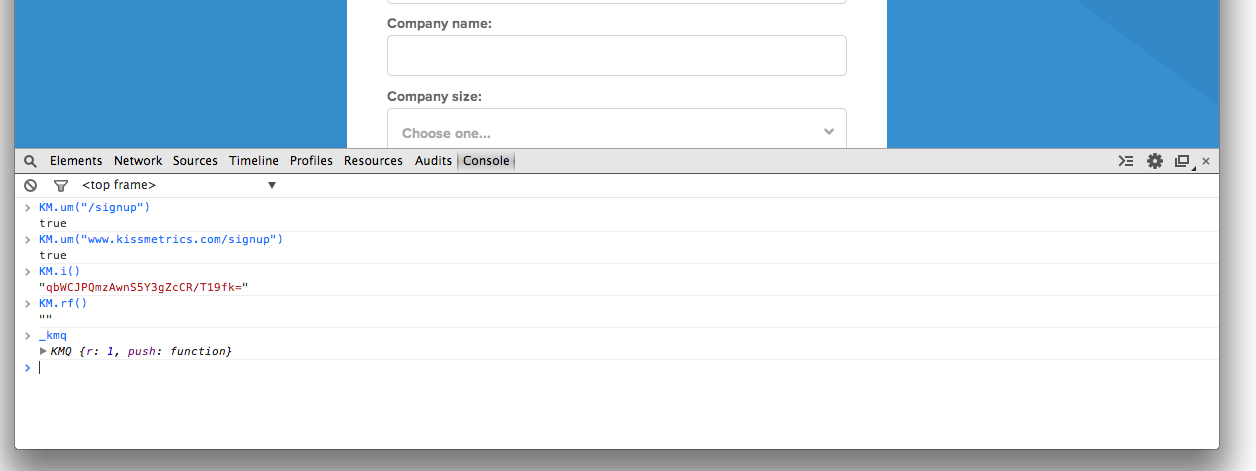
In the console you can run JavaScript commands. Our Javascript library has a reference on available commands.

Updated 10 months ago
